Combine Tmux, btop and a GPU Monitoring Tool for System Monitoring
Here's a quick way to get your system's overall health and it uses a nice trick to programmatically create tmux sessions or windows.
Since I switched to native Linux I wanted a quick way to see my system’s health at a glance.
# System / GPU Tools
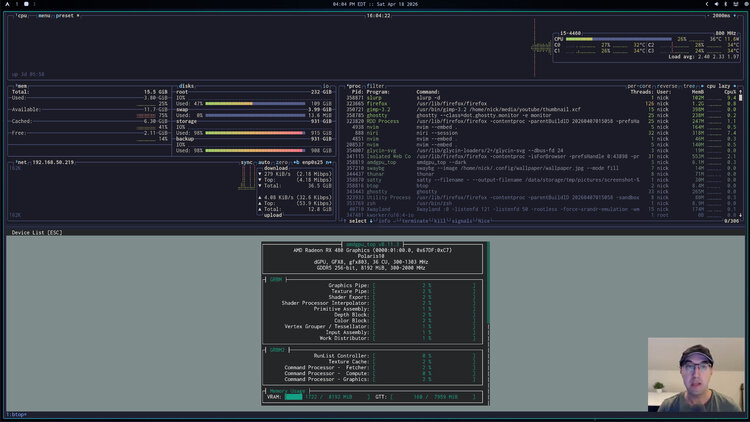
Overall things like CPU, memory, network, disk IO usage and getting a list of processes were topics of interest. Needless to say btop does all of this nicely.
btop doesn’t give in-depth GPU stats but it’s really handy to know things like how much VRAM is being used, which processes are using GPU memory and overall GPU monitoring stats like how many watts your GPU is drawing, GPU temp and fan speed, etc..
There are GPU vendor specific tools to do this for AMD, NVIDIA and Intel and also tools like nvtop which provides a unified UI for each vendor. I prefer using the vendor specific tools but if you prefer nvtop that’s ok, the solution we’ll come up with will pick nvtop if it exists, else fall back to vendor specific tools.
# Game Plan
I envisioned this as a simple monitor shell script with the following launch
rules:
- When launched with a global hotkey:
- Create or attach to a tmux session called “monitor”
- Launch btop in a window
- Launch GPU monitoring tool in a split pane below btop
- When launched by running
monitorin the terminal:- If not in tmux, do the same logic as the global hotkey
- If in tmux, instead of making a separate session create a new tmux window
# The Script
In my dotfiles I created a monitor script:
#!/usr/bin/env bash
# Show an assortment of system monitoring tools together.

set -o errexit
set -o pipefail
set -o nounset

# These dotfiles don't install nvtop on Linux but if it's available it means
# someone has it installed and likely prefers it so let's use it first.
if command -v nvtop >/dev/null 2>&1; then
  gpu_command=("nvtop")
elif command -v amdgpu_top >/dev/null 2>&1; then
  gpu_command=("amdgpu_top" "--dark")
elif command -v nvidia-smi >/dev/null 2>&1; then
  gpu_command=("nvidia-smi")
elif command -v intel_gpu_top >/dev/null 2>&1; then
  gpu_command=("sudo" "intel_gpu_top")
else
  gpu_command=("bash" "-c" "printf 'No GPU monitoring tools available\n\n'; read -p 'Press Enter to close...'")
fi

tmux_command=(new-session -s)
[ -n "${TMUX:-}" ] && tmux_command=(new-window -n)

tmux "${tmux_command[@]}" "monitor" "btop" \; split-window "${gpu_command[@]}"
My dotfiles install any necessary packages for this to work. If you’re not using them you’ll need to install them.
The cool thing is, this isn’t limited to system monitoring, tmux lets you build custom dashboards for whatever you want!
The video below shows it in action.
# Demo Video
Timestamps
- 0:10 – Quick demo
- 1:21 – Only btop by itself
- 1:53 – Looking at the code
- 3:41 – Showing what happens when not in tmux
- 4:37 – Molding your OS for you
- 4:55 – How I have Waybar and niri configured to use it
How do you monitor your entire system at a glance? Let me know below.