Enabling the Flask Interactive Debugger in Development with gunicorn

I'm a big fan of setting up my development environment to be the same as production. That means running gunicorn in dev mode.
One of the cool things about Flask is if you use the built in server for development you gain access to an interactive debugger in your browser.
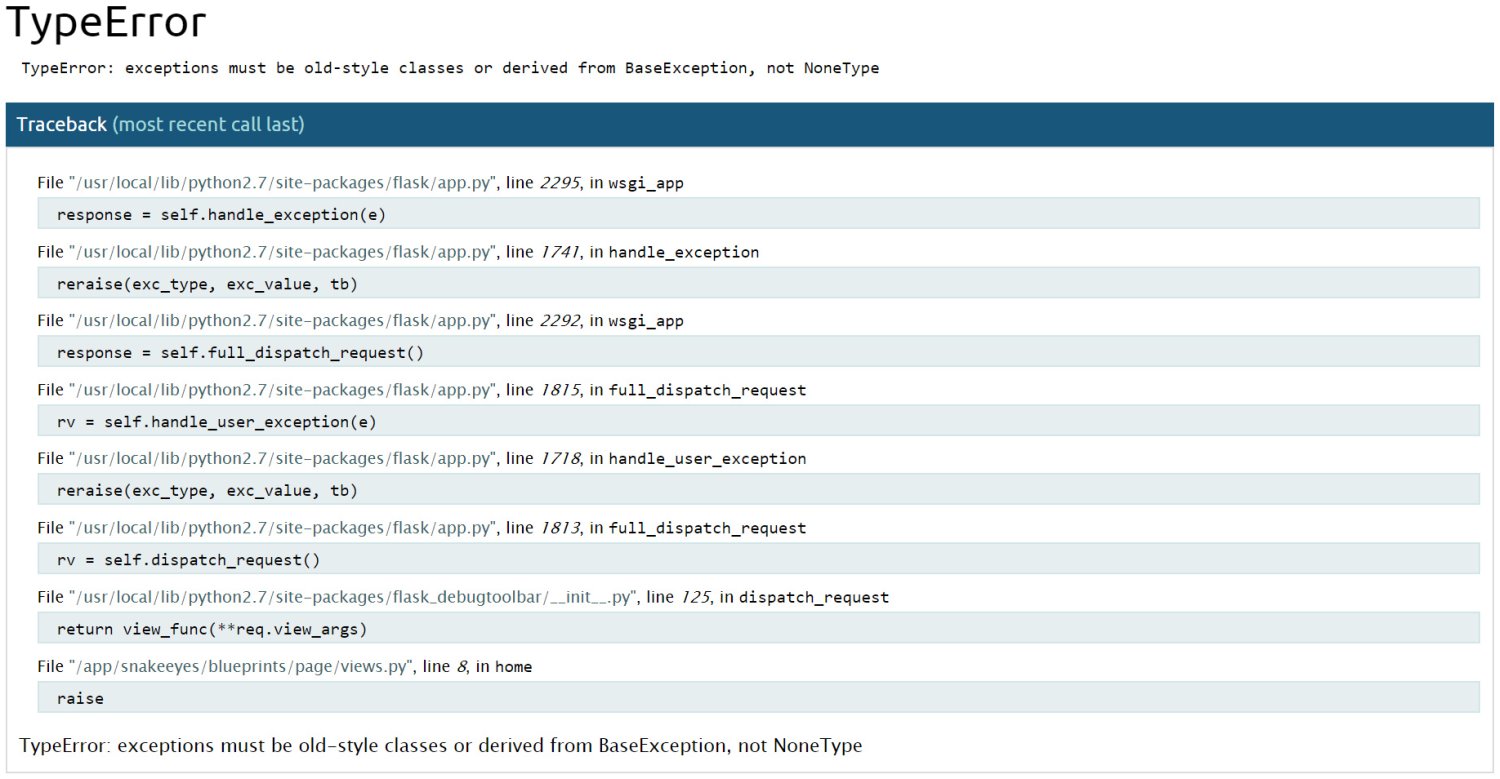
Flask WITH the interactive debugger:

The interactive debugger allows you to execute code directly in your browser at any specific point in the stack trace.
It’s unbelievably useful for debugging exceptions and is often faster than dropping in print statements into your code base when debugging certain types of errors.
Flask WITHOUT the interactive debugger:

As you can see, the difference is night and day. Without having the interactive debugger enabled you get no information about the error in your browser. You would have to go your terminal and read the stack trace there.
# Enabling the Interactive Debugger with gunicorn
The interactive debugger isn’t just limited to Flask’s built in development server. After many years of developing and deploying web applications, I’m a firm believer you should run your development environment to be as close as possible as production.
That’s partly why I love Docker, but in any case, I would avoid using Flask’s built in development server and always run gunicorn in both development and production.
If you’re a uWSGI fan instead, that’s cool, you can use that instead of gunicorn.
Since we can enable the interactive debugger very easily, it’s a no brainer!
Open up your app.py file and then make it look similar to this:
from werkzeug.debug import DebuggedApplication

def create_app():
    # Insert whatever else you do in your Flask app factory.

    if app.debug:
        app.wsgi_app = DebuggedApplication(app.wsgi_app, evalex=True)

    return app
If you’re looking for a complete working example, you can find one in the open source version of my Build a SAAS App with Flask course on GitHub which is updated for Flask 1.0.
You don’t have to, but the example below will expect you to have it all up and running. If not, no worries, we’re only dropping in 1 line of code.
Head over to one of your routes and add the raise keyword before you render a response.
Open snakeeyes/blueprints/page/views.py and then make it look like this:
from flask import Blueprint, render_template

page = Blueprint('page', __name__, template_folder='templates')


@page.route('/')
def home():
    raise

    return render_template('page/home.html')

# ...
If you visit the home page, you’ll see the interactive debugger:
![]()
Mouse over one of the lines in the stack trace and click the console icon.
The PIN dialog box after clicking the console icon:

This is Flask’s way to protect you from accidentally enabling the interactive
debugger in production. In our example, it’s only enabled for app.debug. You
should never enable this in production because it will allow anyone with the PIN
to execute arbitrary Python code. They could wipe out your database, or turn
themselves into an admin, etc..
Finding the PIN in your terminal:

If you run Gunicorn with more than 1 worker the pin may not be output. You can set 1 worker temporarily and restart Gunicorn if you don’t see it.
Just copy / paste it into the dialog box and confirm it.
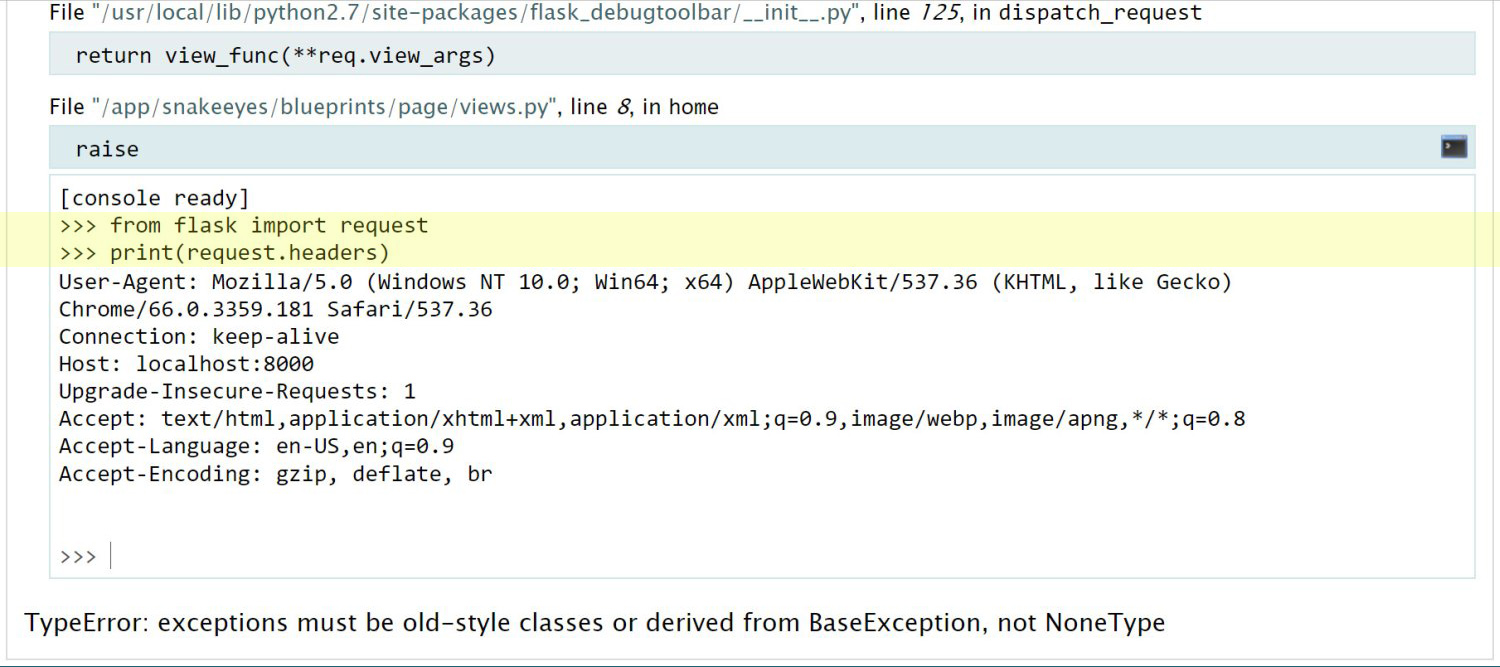
Now you’ll be able to enter in whatever code you want straight in the browser, and it will be in the context of this request since we raised an exception inside of a route.
Getting the headers of a request using the interactive debugger:

All we did was import request and then use it just like we would in the code base.
You can do this to access the current_user if you had one, or experiment with
database queries using SQLAlchemy. There’s no limit.
Disabling the Interactive Debugger
When you’re done playing around with the debugger, just remove the raise
keyword from your code base and everything is back to normal.
Keep in mind, it will come up on its own for real exceptions that occur in your code base.
Disabling the PIN Confirmation
If you no longer want to be bothered by the PIN number every time you start up
your server you can disable it by going to your settings.py and set
WERKZEUG_DEBUG_PIN = 'off'.
Just as a reminder, make sure the debugger isn’t enabled in production!
If you liked this tip, check out the Build a SAAS App with Flask course. It covers over 50 web development topics while we build a real world application that accepts recurring payments with Stripe and so much more.