Using Print Statements Are a Handy Way to Debug and Explore Code
There's lots of ways to debug code, but often times problems become amplified when you can't visualize what's happening.
In the past I’ve written about rubber duck debugging which is one way to help solve problems. Rubber duck debugging is handy because it forces you to explain the problem in great detail which gets you to break it down.
But now let’s say you know what you want to do and you’re trying to implement it. Using print statements can help you go from non-working code to working code very quickly.
# Why Bother Using Print Statements?
When writing software, knowledge really is power. The more you know about what’s happening, the better. Dropping in print statements is a quick way see what’s happening. This isn’t even limited to debugging problems too. It’s useful for general code insight.
That’s why when I write code that doesn’t work on the first attempt, I skip trying to be a hero and just start dropping in print statements everywhere. The faster I discover what’s wrong, the faster I’ll be able to move onto the next thing.
# When Are Using Print Statements Useful?
Here’s 3 situations where I find myself using print statements:
- When you want to quickly see the value of something
- Trying to use a divide and conquer approach in a longer function
- Exploring new code bases and you want some help tracing the code base
Quickly See the Value of Something
One of the biggest lessons I’ve learned over the years is not to assume anything. If you have even an ounce of doubt on what something might be, then print it out to see for sure.
It only takes a few seconds to print it out and confirm. That could save you many many minutes of guesswork (which leads to hours due to getting distracted on Youtube).
Divide and Conquer
In a previous article about microservices I talked about levels of code abstractions.
When dealing with a fairly complicated piece of logic, I tend to inline most of the code into a single function until I work out the logic. I just find that style the easiest to work with.
The problem is hard enough as it is, why bother complicating it by worrying about naming functions and refactoring it as I go before I even understand the problem or have a solution written?
What this usually means is I’ll end up with pretty long functions to begin with. It’s not uncommon to write a 30 or 40 line function on a first pass.
Sometimes you’re not even sure if certain lines of a condition or a piece of code is getting executed, but dropping in a print statement is a very quick way to determine what path of the code is being executed.
It could be as simple as dropping print("Is this being executed?") somewhere.
Exploring New Code Bases
As a freelance developer I’m often tasked with doing something to an existing code base. This could be adding new features, fixing bugs or adding tests. It could be anything.
These applications have a huge range in complexity. Some of them are 100 line Flask apps while others are 100,000+ line Rails apps, but one common trend I find is I rely on printing things to quickly trace a new code base.
Once you get familiar enough with your web framework of choice you have a general idea of when code gets ran based on where it exists, but still, this wildly changes depending on what you’re working on, especially if there’s a lot of meta programming to unwind.
A better example of divide and conquer:
You can’t control the quality of code you didn’t write.
Sometimes you end up in situations where you’re forced to figure out what the heck a 400 line function is doing and of course the person who wrote it is long gone.
What I like to do in these spots is eliminate as much code as possible from the equation in the quickest amount of time possible, then chunk it out.
For example if you drop in a print statement on line 200 and you see it being output then you know for sure at least the first 199 lines are running. You might want to output the value of some variable on line 200.
Then you can output that variable again on line 100 and if the value of that variable is correct on line 100 but incorrect on line 200, you can safely conclude that something is messed up in between lines 101 and 199.
Now you can pop in a print statement on line 150 and check out the variable. If it’s correct then you know the problem is in between lines 151 and 199, or if it’s not correct then you know the problem is somewhere between lines 101 and 149.
This form of using debugging is called bisection search, or binary search depending on where you learned it from. Using print statements in a bisection search fashion lets you ignore code with 100% confidence allowing you to get to the root of the problem quickly.
# Quickly Finding Your Print Statements
A lot of web frameworks have pretty verbose logging in development, and that’s good. As we talked about before, in some cases having more information is better.
But this also means it can be really difficult to find your print statements. Here’s some log output from a Dockerized Phoenix application I happen to be working on at the moment:
web_1       | [info] GET /
web_1       | [debug] QUERY OK source="users" db=1.7ms
web_1       | SELECT u0."id", u0."admin", u0."confirmed_email_at", u0."deactivated_at", u0."email", u0."email_auth_token", u0."name", u0."profile_hexcolor", u0."professional_title", u0."signed_in_at", u0."profile_photo", u0."username", u0."inserted_at", u0."updated_at" FROM "users" AS u0 WHERE (u0."id" = $1) [33]
web_1       | [debug] Processing with LMSWeb.PageController.index/2
web_1       |   Parameters: %{}
web_1       |   Pipelines: [:browser]
web_1       | [info] Sent 200 in 3ms
Nothing too crazy here, this is just rendering the home page, but let’s say we had a print statement thrown into the mix:
web_1       | [info] GET /
web_1       | [debug] QUERY OK source="users" db=1.7ms
web_1       | SELECT u0."id", u0."admin", u0."confirmed_email_at", u0."deactivated_at", u0."email", u0."email_auth_token", u0."name", u0."profile_hexcolor", u0."professional_title", u0."signed_in_at", u0."profile_photo", u0."username", u0."inserted_at", u0."updated_at" FROM "users" AS u0 WHERE (u0."id" = $1) [33]
web_1       | Hi
web_1       | [debug] Processing with LMSWeb.PageController.index/2
web_1       |   Parameters: %{}
web_1       |   Pipelines: [:browser]
web_1       | [info] Sent 200 in 3ms
At a quick glance, finding our print message in that isn’t easy and we’re only dealing with a few lines of log output here. Imagine if you had 5x the amount of lines which took up your entire terminal buffer.
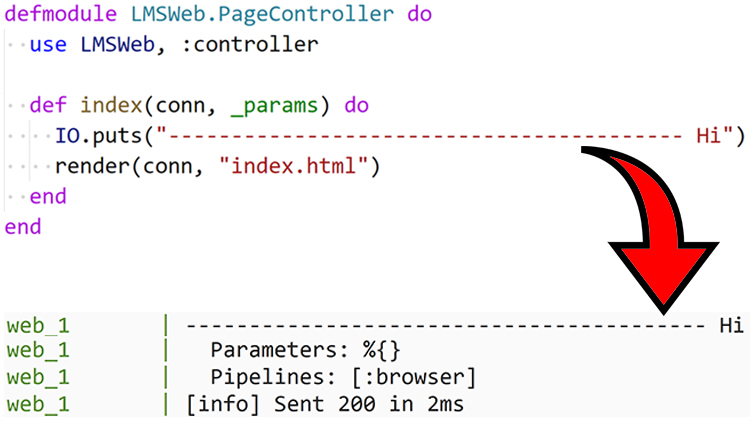
Compare that to:
web_1       | [info] GET /
web_1       | [debug] QUERY OK source="users" db=1.7ms
web_1       | SELECT u0."id", u0."admin", u0."confirmed_email_at", u0."deactivated_at", u0."email", u0."email_auth_token", u0."name", u0."profile_hexcolor", u0."professional_title", u0."signed_in_at", u0."profile_photo", u0."username", u0."inserted_at", u0."updated_at" FROM "users" AS u0 WHERE (u0."id" = $1) [33]
web_1       | ------------------------------------------------------- Hi
web_1       | [debug] Processing with LMSWeb.PageController.index/2
web_1       |   Parameters: %{}
web_1       |   Pipelines: [:browser]
web_1       | [info] Sent 200 in 3ms
Now we can easily see the “Hi” message in a second. Our eye is immediately drawn to it.
For single lines of output I tend to always prefix the message with a bunch of
characters. I don’t always use -. Really, it doesn’t matter as long as you can
see it.
Sometimes if I’m outputting a few variables, I’ll use different characters for
each variable. Perhaps --------------- and ~~~~~~~~~~~~~~~. If it’s the same
variable on multiple lines I’ll include a --------------- L150: or whatever
makes sense.
If I plan to output a few lines of text, I’ll sometimes gate them, such as:
web_1       | [info] GET /
web_1       | [debug] QUERY OK source="users" db=1.7ms
web_1       | SELECT u0."id", u0."admin", u0."confirmed_email_at", u0."deactivated_at", u0."email", u0."email_auth_token", u0."name", u0."profile_hexcolor", u0."professional_title", u0."signed_in_at", u0."profile_photo", u0."username", u0."inserted_at", u0."updated_at" FROM "users" AS u0 WHERE (u0."id" = $1) [33]
web_1       | -------------------------------------------------------
web_1       | Name: Foo
web_1       | Email: foo@bar.com
web_1       | -------------------------------------------------------
web_1       | [debug] Processing with LMSWeb.PageController.index/2
web_1       |   Parameters: %{}
web_1       |   Pipelines: [:browser]
web_1       | [info] Sent 200 in 3ms
So that’s how I approach print statement based debugging. It’s a well used tool in my programming toolbelt.
What tips do you have for debugging with print statements? Let me know below!